Weather-Driven Line Movements: How Atmospheric Patterns Reshape Wagering Dynamics in Outdoor Competitions
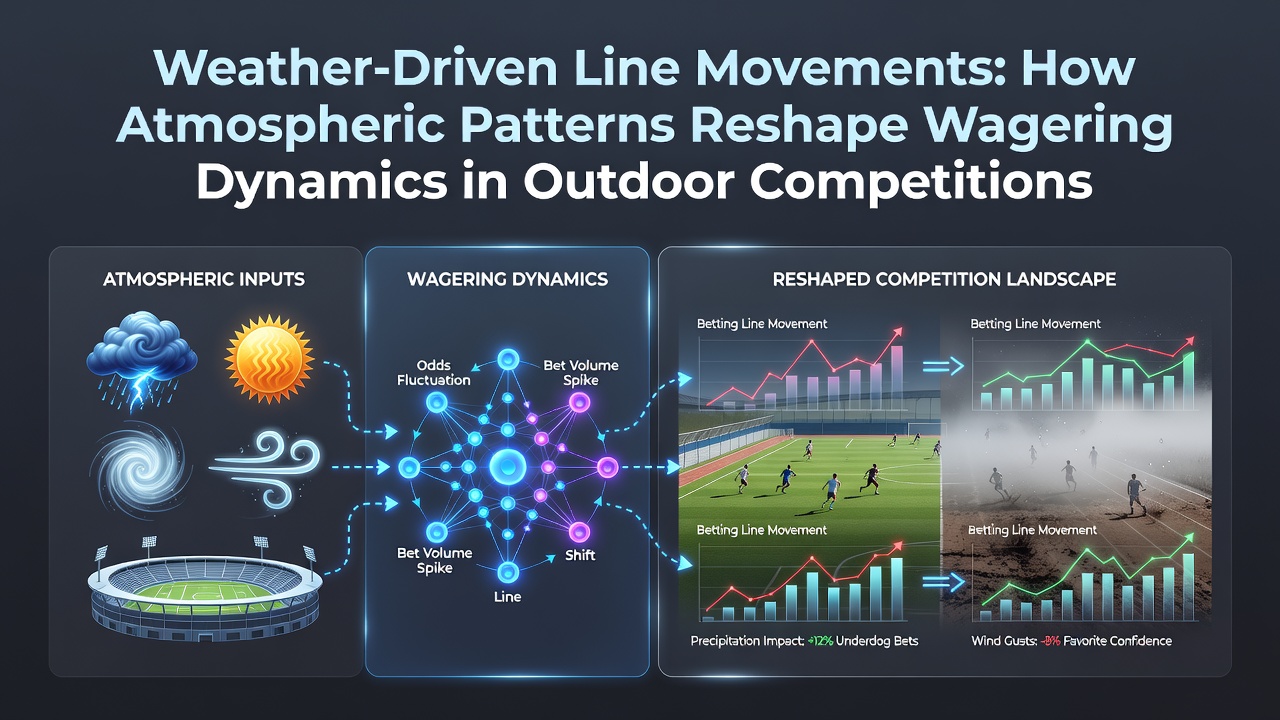
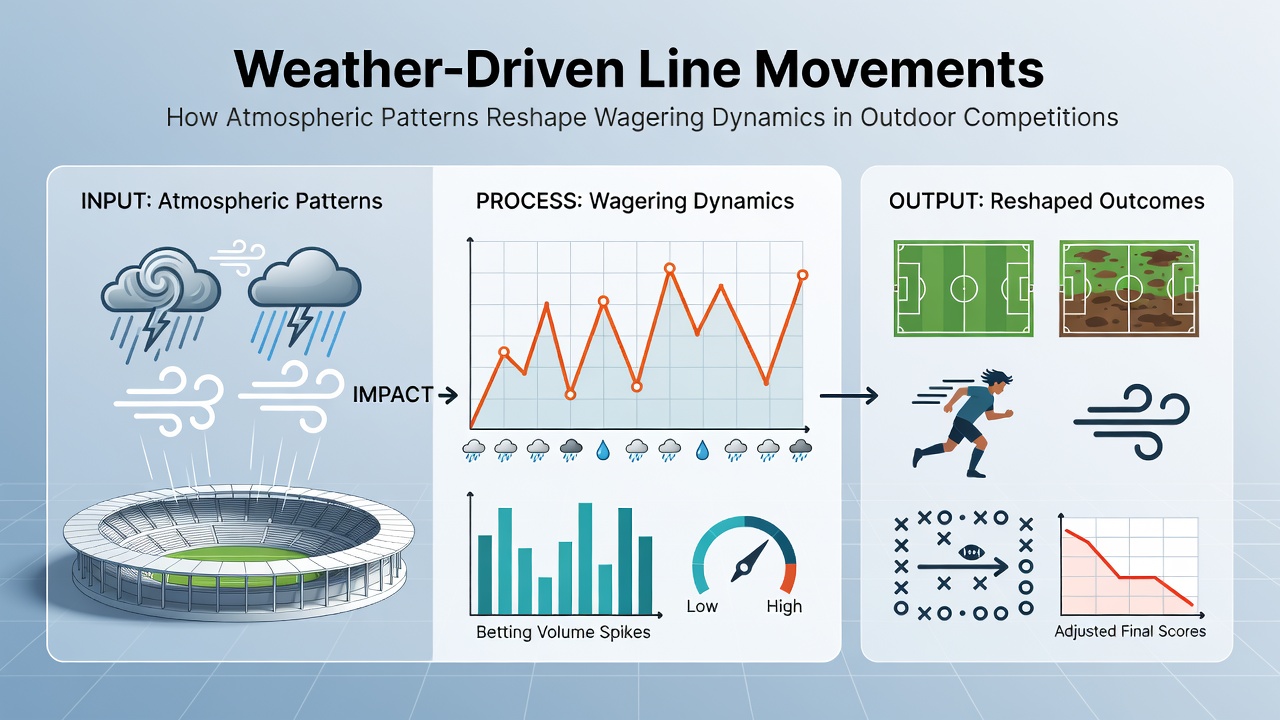
Atmospheric conditions exert measurable influence on outdoor athletic events, and betting markets adjust odds accordingly when forecasts shift. Data from major leagues shows that wind speed, precipitation probability, and temperature extremes correlate with changes in point spreads, totals, and player prop lines across baseball, tennis, golf, and soccer. Operators monitor meteorological reports in real time because even modest variations in barometric pressure or humidity alter ball flight, player endurance, and surface conditions.
Atmospheric Variables and Their Direct Effects on Play
Baseball provides clear examples of how wind direction modifies run totals. A 10-mile-per-hour tailwind at certain stadiums increases home-run probability by documented margins, prompting sportsbooks to raise over/under lines within hours of updated forecasts. Conversely, strong crosswinds reduce batting averages on fly balls, and markets respond by tightening totals. Temperature also matters because warmer air allows baseballs to travel farther; statisticians have tracked seasonal patterns where July games in humid climates produce elevated scoring compared with cooler spring evenings.
Tennis matches on outdoor courts reveal similar sensitivities. High humidity slows ball speed while simultaneously increasing player fatigue, and betting exchanges record rapid adjustments to game totals once radar indicates approaching storms. Rain delays create additional volatility because suspended matches resume under potentially different conditions, and live odds fluctuate accordingly. Observers note that grass surfaces at events like Wimbledon become slicker after light precipitation, favoring certain playing styles and prompting line movements on individual matchups.
Market Response Mechanisms and Timing
Betting platforms integrate weather data feeds from multiple agencies to recalibrate odds. When forecasts update, algorithms trigger automatic line adjustments that reflect revised probabilities. Sharp bettors who track meteorological models often place wagers before these shifts occur, which accelerates further movement once public money follows. Studies of historical data indicate that the largest line changes in outdoor events happen between 12 and 36 hours before start times, coinciding with the most reliable forecast windows.
Golf tournaments demonstrate particularly granular reactions because individual player props depend on wind readings at specific holes. A sudden gust forecast can shift a golfer's over/under for birdies by several strokes, and markets reflect those revisions within minutes. Data indicates that courses with exposed fairways experience larger swings in scoring averages during windy conditions, and bookmakers maintain separate models for each venue to account for topography and prevailing wind patterns.
Regional and Seasonal Patterns in 2026
July 2026 brought elevated temperatures across North American and European outdoor venues, and betting volumes on totals increased as operators adjusted lines upward in response to sustained heat. Soccer matches scheduled during peak afternoon hours showed higher over probabilities because elevated temperatures correlate with increased substitutions and altered pace. Regulatory filings from multiple jurisdictions reveal that sportsbooks reported measurable upticks in weather-related line adjustments during this period compared with earlier months.
Canadian and Australian regulators have examined how operators incorporate environmental data into risk management. Reports from Environment and Climate Change Canada highlight correlations between precipitation forecasts and reduced handle on certain outdoor props, while Australian meteorological services provide venue-specific wind models used by international betting firms. These geographic differences in data sources allow operators to cross-verify forecasts and reduce exposure to single-model errors.
Technological Integration and Forecasting Accuracy
Advances in localized weather modeling now supply minute-by-minute updates to betting systems. Machine-learning models trained on historical event data combine radar, satellite imagery, and ground sensors to predict micro-conditions at stadiums and courses. When these models detect discrepancies with earlier forecasts, lines move accordingly. Industry reports show that operators maintaining multiple independent weather inputs experience fewer instances of large post-event discrepancies between projected and actual scoring.
Academic research from institutions studying sports analytics confirms that atmospheric variables explain measurable portions of variance in scoring distributions. These findings support the continued refinement of betting algorithms that treat weather as a dynamic input rather than a static factor. As forecast precision improves, line movements become more frequent but smaller in magnitude, reflecting incremental updates rather than wholesale revisions.
Conclusion
Weather patterns continue to drive measurable shifts in wagering markets for outdoor competitions because atmospheric conditions directly affect performance metrics that determine outcomes. Operators integrate real-time meteorological data to maintain accurate odds, while bettors who monitor the same inputs gain opportunities to act before adjustments occur. Data from 2026 demonstrates consistent patterns across baseball, tennis, golf, and soccer, underscoring the ongoing relationship between environmental variables and market dynamics.