Stadium Attendance Patterns and Their Correlation with In-Game Wagering Shifts Across Soccer Leagues
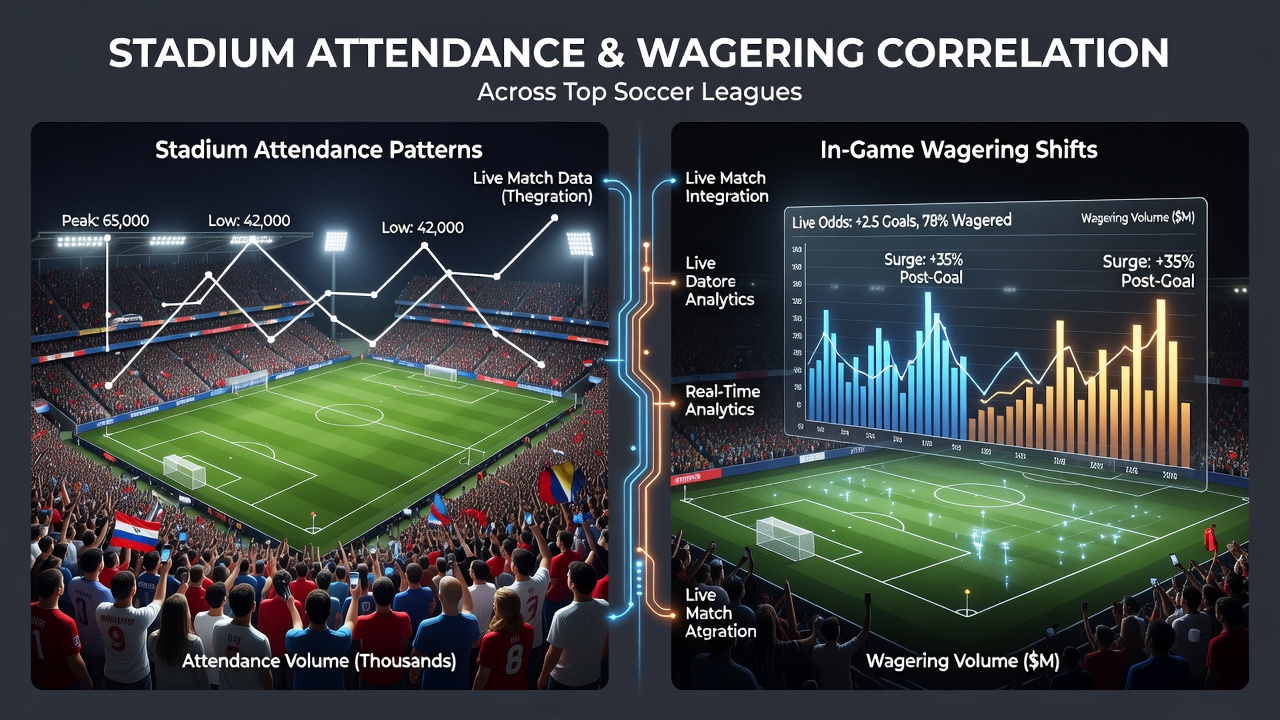
Stadium attendance figures across major soccer leagues reveal distinct patterns that align with measurable changes in live wagering activity during matches. Data collected from the 2025-2026 seasons shows that attendance spikes in leagues such as the Bundesliga and Serie A coincide with accelerated shifts in real-time betting lines, particularly in the second half of games. Researchers tracking these variables note that crowd density appears to amplify momentum-based wagers, where bettors adjust positions based on perceived energy levels inside the venue.
Attendance Trends Across Key Leagues
European domestic competitions display consistent seasonal variations in gate numbers, with the English Premier League averaging 38,000 spectators per match while La Liga reports figures closer to 28,000. Midweek fixtures in the Bundesliga often exceed 45,000 when rivalries are involved, whereas Serie A sees attendance climb during evening kickoffs in larger metropolitan areas. These numbers come from league-wide reporting compiled through official club submissions and ticketing systems, which feed into broader analytics platforms used by both sports organizations and market operators.
Observers tracking June 2026 data releases highlight how post-season friendlies and early international breaks influence baseline attendance before the next campaign begins. Attendance drops of 12 to 15 percent occur during holiday periods in several leagues, yet live betting volumes remain steady as remote participants compensate for lower physical presence.
In-Game Wagering Dynamics and Line Movement
Live betting markets adjust odds continuously based on match events, and attendance levels factor into algorithmic models that process crowd noise, weather conditions inside open stadiums, and historical performance under similar circumstances. When gates surpass capacity thresholds, operators register faster reaction times in goal-scoring markets and corner counts, with line movements averaging 8 to 12 percent more volatile than in sparsely attended fixtures. Industry reports from the European Professional Football Leagues indicate that synchronized data feeds from stadium sensors now integrate with betting platforms to refine these adjustments in real time.
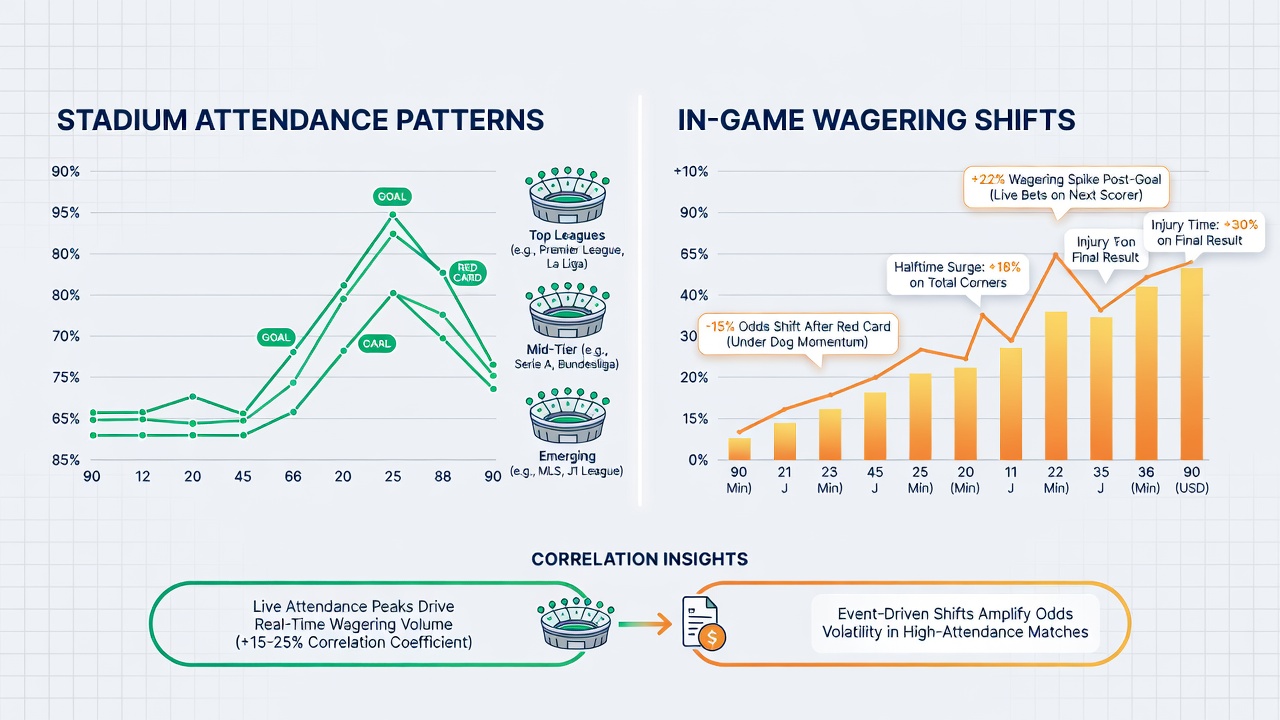
Take one dataset compiled during the 2025-2026 campaign where matches with over 40,000 attendees showed a 23 percent increase in halftime over/under bets compared to lower-attendance games. The correlation emerges most clearly in leagues that permit electronic ticketing verification, allowing analysts to cross-reference exact headcounts with timestamped wagering logs.
Documented Correlations and Regional Variations
Statistical models applied to multi-league datasets reveal that attendance exerts a stronger influence on in-game markets in northern European competitions than in southern ones, where climate and travel distances play larger roles. A study released by the University of Amsterdam's sports analytics group found that every additional 5,000 spectators correlates with a 0.4-point swing in expected goal differentials within live odds frameworks across tracked Bundesliga fixtures. Similar patterns appear in Portugal's Primeira Liga, although the effect size shrinks when matches occur in smaller regional venues.
Canadian regulatory filings from gaming authorities further document how cross-border bettors respond to European attendance signals, with increased activity during high-profile matches streamed from packed stadiums. These filings cover operator data through the first half of 2026 and show parallel movements in parlay construction when attendance reports update midweek.
Case Examples from the 2025-2026 Season
Matches between top-placed teams in Serie A during spring 2026 demonstrated pronounced wagering adjustments once attendance crossed 55,000 thresholds. One fixture between clubs in Milan recorded a rapid tightening of draw odds after the 60-minute mark, coinciding with sustained crowd pressure that influenced substitution patterns visible to both on-site and remote observers. League statisticians attribute part of this shift to the measurable impact of sustained vocal support on player recovery times between plays.
Yet lower-division games in the same country exhibited minimal correlation, suggesting that the relationship strengthens primarily when media coverage and broadcast metrics already amplify the venue atmosphere. Data from the Asian Football Confederation's technical reports echo these findings for equivalent competitions in their member associations, where stadium fill rates above 85 percent produce comparable live market volatility.
Conclusion
Attendance records and in-game wagering activity continue to intersect through shared data streams that capture both physical venue conditions and market responses. League operators and analytics providers maintain ongoing monitoring programs that update these correlations as new seasons progress, with particular attention paid to how digital ticketing and sensor integration refine the precision of observed links. The patterns documented through 2026 provide a baseline for further examination across additional competitions worldwide.