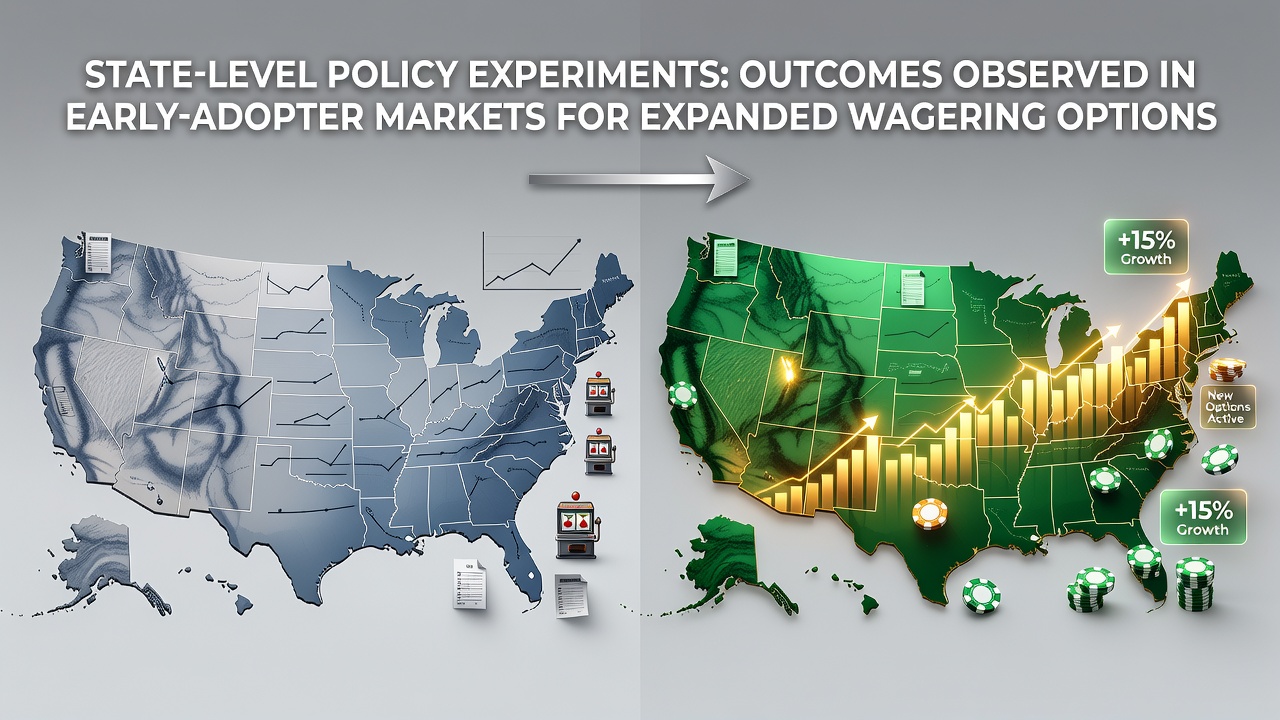
Early State Experiments Reveal Patterns in Expanded Wagering Markets
States that moved first on expanded wagering options have generated datasets that regulators and operators continue to examine, with results emerging steadily through the summer of 2026. New Jersey, Pennsylvania, and Michigan implemented frameworks that allowed additional bet types and operator licenses, while Colorado and Virginia followed with their own variations on tax structures and consumer protections. Data from these markets show differences in handle growth, tax collections, and participation rates that depend on specific policy choices rather than uniform national trends.
According to figures released by the New Jersey Division of Gaming Enforcement, mobile wagering accounted for the majority of activity in early-adopter states by mid-2026, with basketball and football driving seasonal spikes. Those states that paired lower tax rates with broader product approvals recorded steadier year-over-year increases in taxable revenue compared with states that imposed higher rates from the outset. Observers note that the timing of legalization also mattered, since markets that opened before 2022 captured a larger share of initial user acquisition before competition intensified.
Revenue and Participation Metrics Across Jurisdictions
Revenue outcomes have varied with the details of each state's approach. Michigan reported consistent monthly totals after its launch window closed, while Virginia saw quicker initial growth that later stabilized once promotional restrictions took effect. Tax receipts in these jurisdictions have funded designated state programs, though the percentage allocated to problem-gambling services differs by statute. Researchers tracking account registrations found that states requiring in-person verification at launch experienced slower early uptake than those permitting fully remote onboarding with identity checks.
Additional data points from August 2026 indicate that states updating their rules mid-year achieved measurable shifts in operator behavior. Adjustments to hold percentages and bonus structures prompted changes in player retention metrics, according to aggregated reports from multiple gaming control boards. One pattern that stands out involves the concentration of activity around major sporting events, where handle spikes remain pronounced regardless of the underlying regulatory model.
Regulatory Adjustments and Market Responses
Early-adopter states have continued to refine their frameworks based on observed results. Several jurisdictions introduced new reporting requirements for operators in 2025 and 2026 to capture more granular data on bet types and user demographics. These updates allowed regulators to compare outcomes across product categories, including in-game wagering and same-game parlays, which expanded after initial approvals.

Industry groups such as the American Gaming Association have compiled cross-state comparisons that highlight how differing tax rates correlate with operator investment levels. States with more moderate taxation attracted additional platform features and marketing spend, whereas higher-tax environments saw slower rollout of certain bet categories. Academic studies from research centers tracking these markets emphasize that consumer protection measures, such as deposit limits and self-exclusion tools, show higher usage rates in states that mandated prominent placement of those options within apps.
Cross-State Comparisons and Emerging Data Trends
Patterns observed so far suggest that the sequence of policy rollout influences long-term market shape. States that legalized retail and mobile simultaneously recorded different adoption curves than those that staggered the two channels. Data compiled through August 2026 also point to regional economic factors playing a role, with states near established gaming corridors experiencing faster stabilization of handle figures once initial novelty wore off.
Reports from the Canadian federal gaming research programs provide a contrasting reference point, showing how provincial models with centralized oversight produced steadier tax yields even when product menus remained narrower. Those comparisons have informed ongoing discussions among U.S. state legislators considering further expansions or adjustments to existing rules.
Conclusion
Early-adopter states continue to supply the most detailed records available on expanded wagering outcomes, and those records now cover multiple full seasons of operation. Differences in tax policy, licensing, and consumer safeguards have produced measurable variations in revenue, participation, and operator strategies. As additional states evaluate similar expansions, the accumulated figures from the first wave of markets offer concrete reference points for policy design without requiring speculation about future developments.