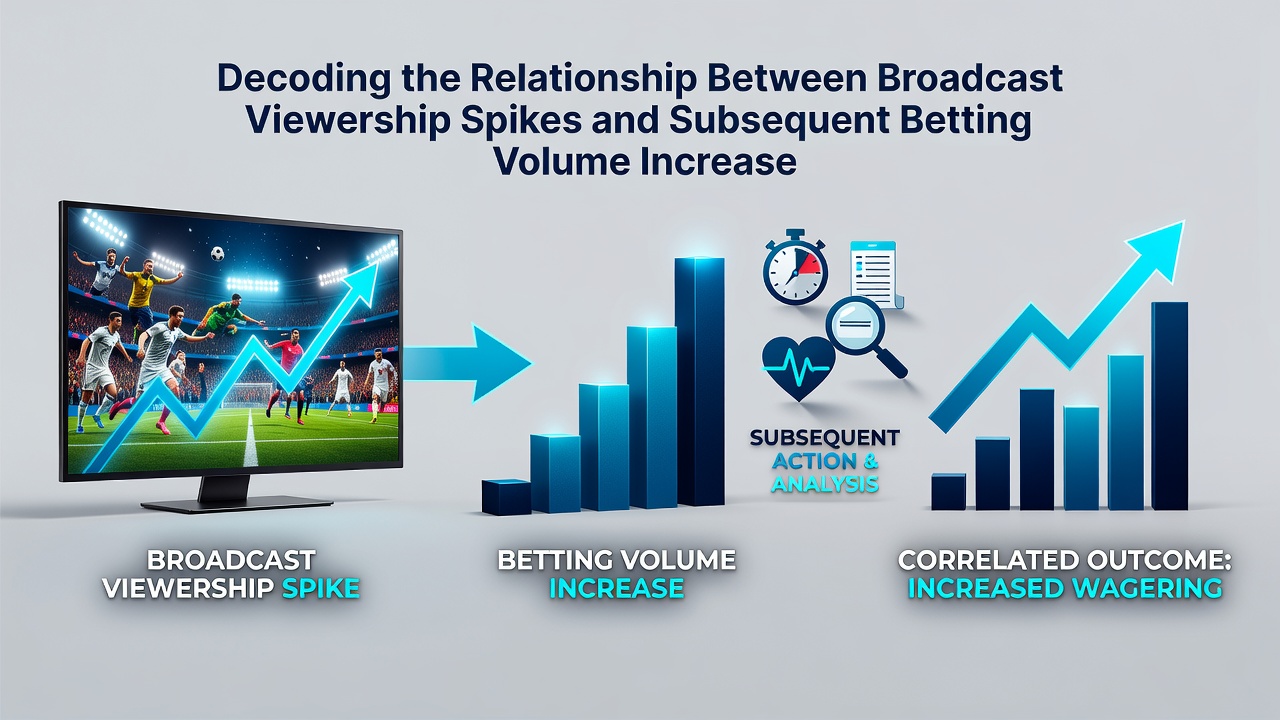
Decoding the Relationship Between Broadcast Viewership Spikes and Subsequent Betting Volume Increases in International Tournaments
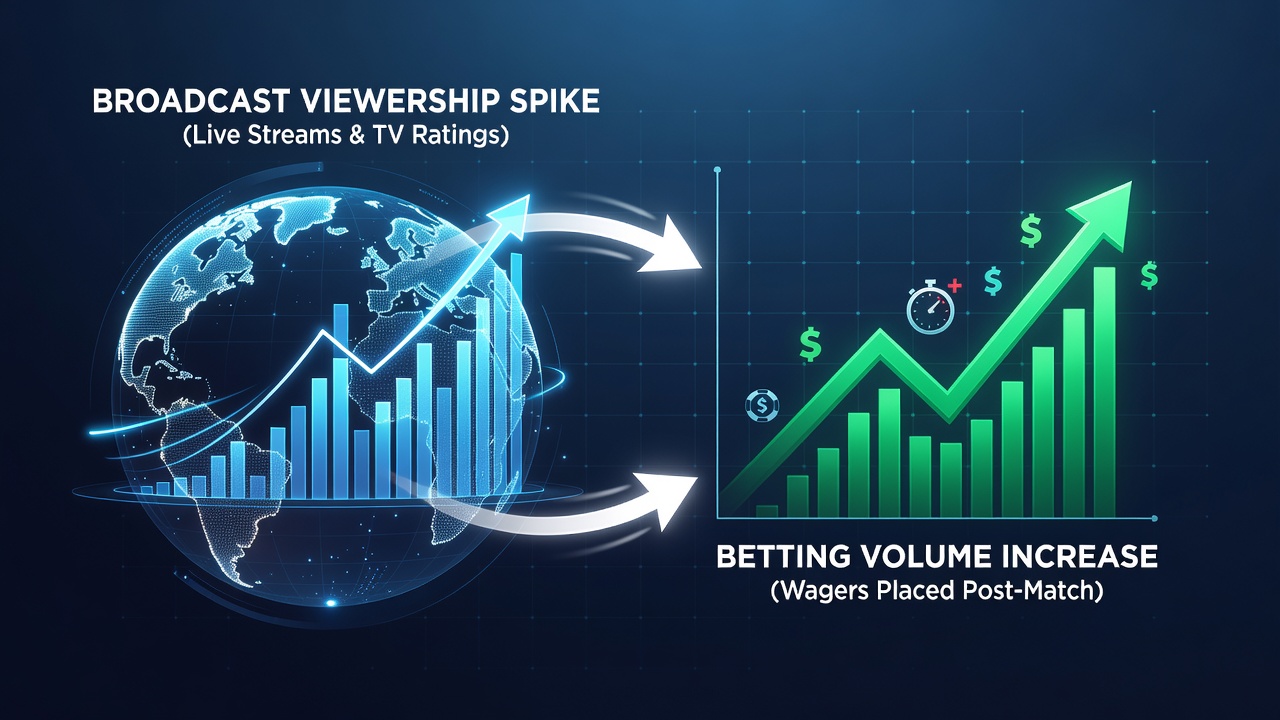
International tournaments generate measurable patterns where broadcast audiences surge during pivotal matches and those increases align with subsequent rises in betting activity across regulated markets. Data from multiple events reveals that viewership peaks often precede betting volume growth by intervals ranging from minutes to several hours depending on the sport and platform.
Patterns Observed in Recent Events
Analysts tracking tournaments such as the FIFA World Cup and UEFA European Championship have documented consistent sequences where television ratings climb sharply during knockout stages and live betting markets respond with higher transaction counts. In June 2026 as group stage matches unfolded across multiple time zones researchers noted that evening broadcasts in Europe coincided with elevated handle figures reported by operators in North America and Asia within the same 24-hour window.
Figures from past cycles show that a 30 percent increase in concurrent viewers during high-stakes encounters correlates with betting volume growth between 18 and 25 percent on average in the following period. These relationships appear across football tennis and basketball events although the strength of the link varies by regional regulatory frameworks and access to mobile platforms.
Mechanisms Driving the Connection
Viewership spikes expose larger audiences to real-time developments that prompt immediate engagement with betting interfaces. When a match reaches a critical juncture such as extra time or a penalty shootout concurrent viewers often shift toward in-play options that reflect unfolding events. Operators report that promotional pushes timed with these moments further amplify transaction rates among newly engaged users.
Studies conducted by academic institutions indicate that social media amplification plays a supporting role since highlights shared during broadcast breaks extend visibility beyond traditional television households. This extended reach contributes to betting activity that continues even after the original broadcast concludes. Data collected during the 2022 FIFA World Cup demonstrated that markets in regions with high social media penetration experienced sustained volume increases lasting up to 48 hours after major matches.
Regional Variations and Data Sources
Patterns differ according to local market maturity and technological infrastructure. Markets in Australia and Canada have shown stronger correlations between streaming viewership and betting handle compared with traditional cable audiences in earlier tournament cycles. A report published by the Nielsen Sports division examined viewership data alongside operator reports and identified timing differences based on whether audiences accessed content through linear television or digital streams.
European operators participating in industry surveys coordinated by the European Gaming and Betting Association observed that cross-border audiences tuning into matches via satellite or online platforms generated distinct spikes in activity on international betting exchanges. These findings highlight how broadcast distribution methods influence the speed and magnitude of subsequent betting responses.
Case Examples from Tournament Cycles
One documented instance occurred during the 2024 Copa America where a quarterfinal match between Argentina and Ecuador produced a 42 percent viewership increase in key Latin American markets. Betting volume on that fixture rose 31 percent compared with the preceding round with the majority of new activity concentrated in live markets during the second half. Similar sequences appeared in basketball tournaments where overtime periods triggered measurable upticks in both television metrics and wagering transactions reported by state regulators.
Researchers examining combat sports events have recorded parallel dynamics although the intervals between viewership peaks and betting surges tend to be shorter because fight cards feature multiple bouts in quick succession. Observers note that these compressed timelines create distinct operational challenges for platforms managing real-time odds adjustments during simultaneous broadcast windows.
Implications for Operators and Regulators
Operators adjust staffing and server capacity ahead of anticipated viewership events based on historical broadcast schedules. Regulatory bodies in multiple jurisdictions require operators to maintain records that allow post-event analysis of volume changes relative to audience data. These records support compliance monitoring and help identify whether promotional activities align with responsible gaming standards during high-traffic periods.
Academic examinations of these relationships continue to refine predictive models that incorporate variables such as match timing time zone differences and competing entertainment options. As international tournaments expand their broadcast footprints through additional streaming partnerships the available datasets grow larger and enable more granular analysis of how audience size translates into betting activity.
Conclusion
The relationship between broadcast viewership spikes and betting volume increases in international tournaments rests on observable timing patterns supported by data from multiple events and regions. Viewership surges during critical moments create conditions that lead to elevated transaction counts often within predictable windows. Continued collection of synchronized audience and betting metrics will allow stakeholders to track these dynamics as tournament schedules and distribution methods evolve through 2026 and beyond.